Tangent method in ABC analysis
A feature of the tangent method in ABC analysis is that there are no fixed group borders, so that the threshold values of groups A, B and C do not have to be checked regularly.
ABC analysis is a popular structural analysis method used in solving logistics problems (e.g. inventory management). The method is based on the Pareto principle, which states that "20% of the effort produces 80% of the result, while the remaining 80% of the effort produces only 20% of the result".
The classical method of the ABC analysis is based on the assumption that the Pareto law applies in the economy and is found in particular in the stock statistics. However, it has long been known that the popular 80:20 ratio does not represent an objective relationship between quality characteristics and inventory items and therefore cannot automatically be used for ABC analysis in inventory management.
The appearance of the Pareto chart can be considered constant only over relatively small time intervals. In reality, the appearance of the chart is dynamic and depends on many factors to whose changes it is sensitive. Consequently, the thresholds for groups A, B, and C cannot be fixed and must be reviewed periodically. Otherwise, the results of the analysis could lead to wrong decisions.
A possible solution to this problem could be the method of tangent analysis. This method is characterized by the fact that there are no fixed group borders, which makes a regular review of the threshold values of groups A, B and C unnecessary.
The graphical method of ABC analysis - the tangent method
The graphical method of ABC tangent analysis includes the following steps:
-
The goals of the analysis are defined.
-
The objects and factors of the analysis are determined.
a. Objects can be e.g. products or product groups
b. Factors are e.g. the turnover or the quantity
-
The data for the ABC analysis is collected and prepared.
-
The data set is sorted in descending order of factor values (e.g. by sales).
-
The calculation of the following parameters is required to construct the Pareto curve:
a. The share of the individual object factors in the total sum of the factors (e.g. the turnover share);
b. The cumulative sum of the shares of the object factors (e.g. the total sales).
-
A Pareto curve is drawn based on the obtained cumulative sum values:
a. X-axis: objects of analysis
b. Y-axis: the values of the cumulative total share of the factors in the total sum.
-
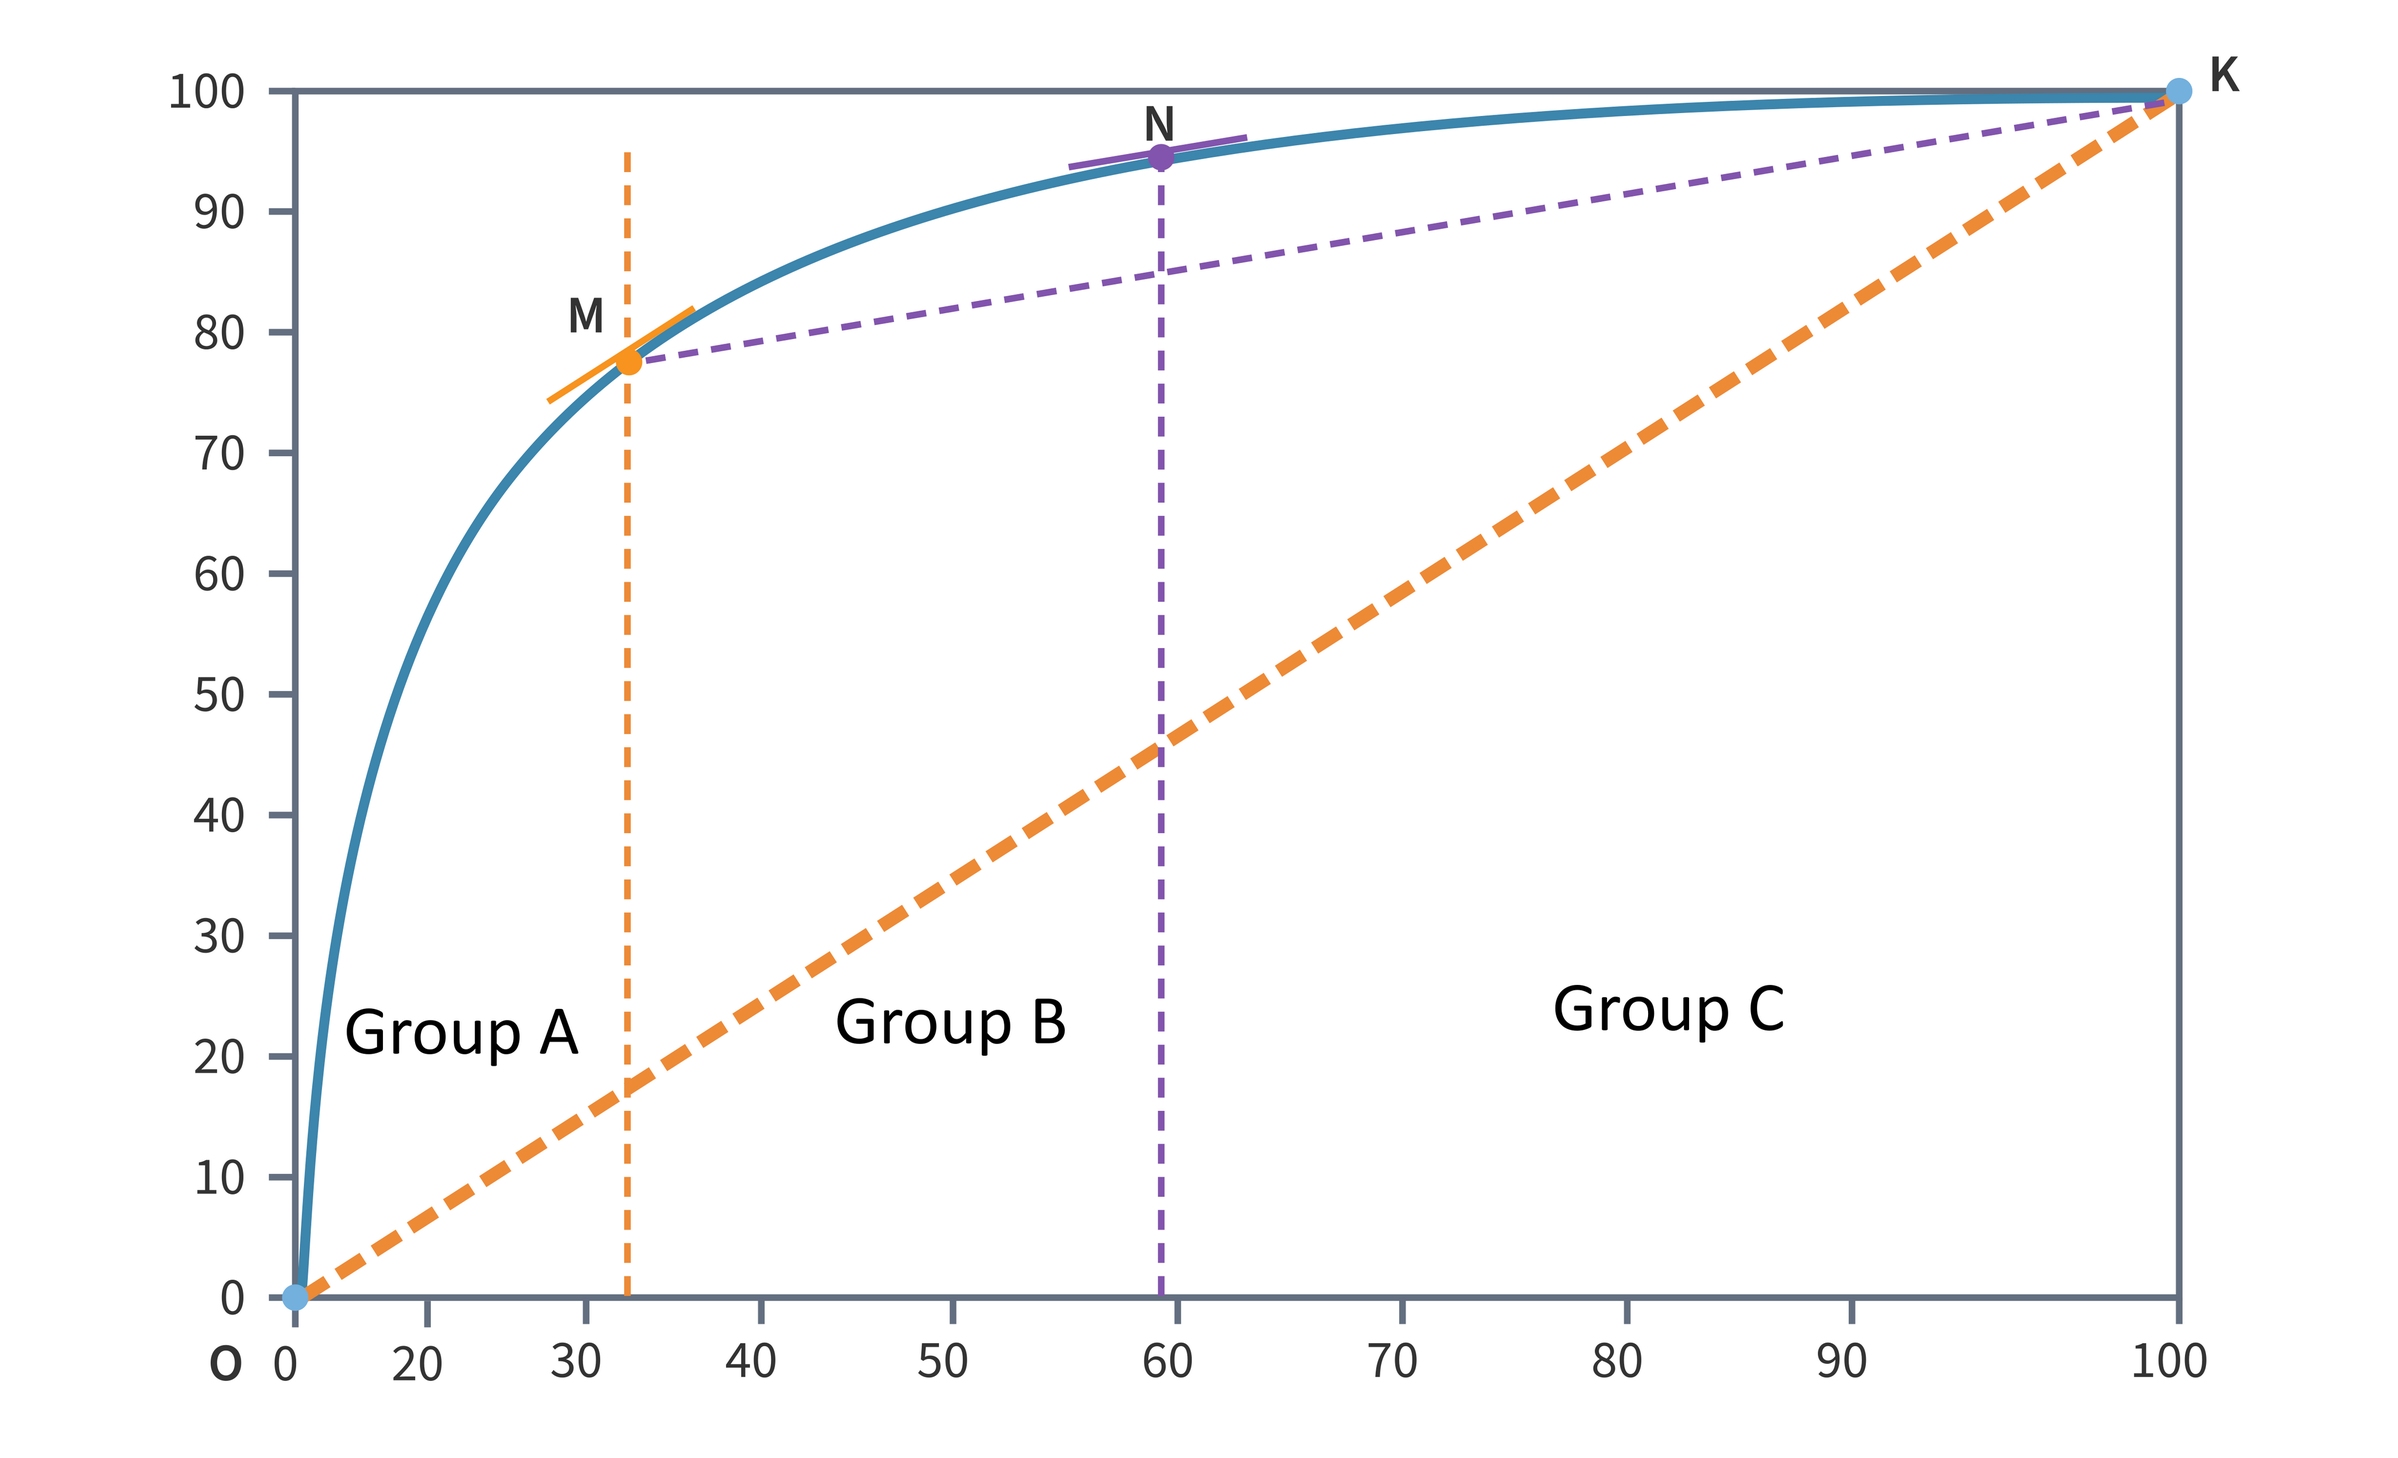
The points O (at zero) and K (at 100%) are marked on the Pareto curve.
-
A line is drawn between O and K
-
The point M on the Pareto curve is determined using the parallel shift or by drawing the normal to the point where the tangent of the graph is parallel to the OK line.
-
The objects lying to the left of the projection of point M on the x-axis are to be assigned to group A.
-
A line from point M to point K is drawn.
-
The point N on the graph of the ABC curve, where the tangent to the graph is parallel to the segment MK, is to be determined.
-
The objects lying to the left of the projection of the point N on the x-axis are included in the group B.
-
The objects that lie to the right of the projection of the point N on the x-axis are to be assigned to group C.
The result of the analysis is the classification of objects into groups A, B and C:


