Data collection for analysis
This article describes the basic data collection steps that can be followed to obtain the right amount of qualitative data for analysis. The methodology is not a strict set of rules, but a list of recommendations that should be followed.
In data mining, machine learning algorithms are used to predict the evolution of the situation, identify patterns, evaluate the importance of factors, etc.
There are many such algorithms, but even the most powerful ones cannot guarantee a good result. Machine learning algorithms can find patterns in data only if the information has been collected correctly. In practice, data problems are usually the cause of failures.
Below are the data collection steps that can be used to prepare high-quality data in the right quantity for analysis. The proposed methodology is simple and logical, but inexperienced analysts almost always make the same trivial mistakes. If you follow the described rules, the probability of getting high-quality results will increase. These methods are not a rigid set of rules, but a list of recommendations to follow.
The general scheme for applying data mining algorithms consists of the following steps:
- Formulating the hypothesis
- Collecting and organizing data
- Selecting a model to explain the collected data
- Testing and evaluating the results
- Application of the model
However, it is possible to go back one or more steps in each phase.
This flow is domain independent and can therefore be used for any area.
Formulating hypotheses
A hypothesis is a conjecture about the influence of certain factors on the analyzed process. The form of the relationship does not matter. That is, when making a hypothesis, one can say, for example, that sales are influenced by the deviation of the product price from the market average, but not specify how exactly this factor influences sales. Machine learning is used to determine the form and extent of dependencies.
It is not possible to automate the process of hypothesis generation, at least not at the current state of the art. This task must be performed by experts. It is possible and necessary to rely on their experience and expertise. It is necessary to make the best use of their knowledge of the subject and gather as many hypotheses/assumptions as possible.
A good tactic for this is brainstorming, collecting and systematizing all ideas without attempting to evaluate their appropriateness. The result of this step should be a list of all the factors proposed by the experts.
For example, for the demand forecasting task, it could be a list of the following: Season of the year, day of the week, sales volume in the previous weeks, sales volume in the same period of the last year, advertising campaign, marketing activities, product quality, brand, price deviation from the market average, availability of competitors' goods.
When selecting influencing factors, it is necessary to abstract from existing information systems and available data. Very often analysts want to use data from existing accounting systems as a starting point. This sounds something like this: "We have such and such data: What can be derived from it?".
This seems logical at first glance, but it is bad practice. The analysis should be based on the task at hand, and the data should be tailored to that task, rather than taking the available information and figuring out what to "get" from it. It should be remembered that accounting systems collect information that is necessary for their tasks, for example, what is important for the balance sheet is meaningless for the task of customer segmentation.
After creating a table describing the factors, it is necessary to expertly evaluate the importance of each factor. This evaluation is not final - it is considered as a starting point. In the course of the analysis, it may turn out that a factor that the experts considered important is not, and conversely, an attribute that they do not consider important has a significant impact.
In most cases, the number of hypotheses is large, so it is not possible to collect and analyze all the data. A reasonably limited list of factors must be used. It is easiest to rely on expert judgment about the importance of attributes. This is especially true since actual data often confirm their opinions.
The result of this step might be a table of the following form:
| Indicator | Expert assessment of importance (1-100) |
|---|---|
| Season | 100 |
| Day of the week | 80 |
| Sales of the last weeks | 100 |
| Sales volume for the same period of the previous year | 95 |
| Advertising campaign | 60 |
| Marketing activities | 40 |
| Product quality | 50 |
| Brand | 25 |
| Price deviation from average market price | 60 |
| Availability of this product among competitors | 15 |
Formalization and data collection
The next step is to define how the data will be represented by selecting one of the 4 types: - Number, String, Date, Logical Variable (yes/no).
Some data are quite easy to formalize, i.e. to define the way they are represented. For example, the turnover in Euro is a number. However, there are often situations where it is not clear how a factor should be represented.
Most often, such problems occur with qualitative characteristics. For example, sales volume is affected by the quality of the product, but this is quite a complex concept and it is not clear how to represent it. However, if this attribute is really important, you need to think about how to formalize it. For example, define quality by the number of defects per thousand units or by expert opinion, dividing it into several categories - poor/fair/good/very good/excellent.
Next, estimate the cost of collecting the data needed for the analysis. Some data is readily available, e.g., it can be downloaded from existing information systems. However, there is information that is difficult to collect, such as information on the availability of competitors' products. Therefore, you need to estimate how much it will cost to collect the data.
The more data you have to analyze, the better. It is easier to discard it at a later stage than to collect new information. Also, keep in mind that experts' assessments of the importance of factors don't always match reality, which means you don't know at the beginning what is actually important and what is not. Because of the great uncertainty, you have to rely on experts' opinions about the importance of factors, but in reality these hypotheses cannot be confirmed. Therefore, it is desirable to collect more data to evaluate the impact of as many indicators as possible.
However, data collection is not an end in itself. If information is easy to obtain, then of course it must be collected. If the data are difficult to obtain, then the cost of collecting and systematizing them must be weighed against the expected results.
There are several methods for collecting the data you need for your analysis. They are listed in order of increasing cost:
-
Export from the accounting systems. In most cases, accounting systems have mechanisms for exporting data or there is an API for accessing this data. Therefore, extracting the required information from accounting systems is usually a relatively simple process.
-
Extracting information from indirect data. Many indicators can be derived from indirect factors. For example, it is possible to estimate the actual financial situation of the inhabitants of a given region. In most cases, there are several products that perform the same function but differ in price: Products for the low-income, for the middle-income group, and for the affluent. If data on sales per region are available, it is possible to analyze in what proportion the goods are sold for each category of customers: The higher the proportion of expensive products, the wealthier the average person in the region.
-
Use of open sources. Much data is available in open sources, e.g., statistical compilations, company reports, published results of market research, etc.
-
Buying data from social networks, mobile operators, and data brokers. There are many companies on the market that collect and sell data. They provide systematized information on API: credit score, customer preferences, product prices, geolocation, etc.
-
Conducting their own market research and similar data collection activities. This can be quite costly, but in any case, this data collection option is possible.
-
Manual data entry, where data is entered based on various types of expert judgment by the organization's staff. This method is labor intensive and requires constant resources to ensure that the data is up-to-date.
The effort required to collect information using different methods varies greatly in terms of both cost and time required. The costs should therefore be weighed against the expected results. Some data collection may need to be abandoned, but the factors that the experts have identified as most important should be collected regardless of the cost of the work, or the analysis should be abandoned altogether.
Of course, if an expert has identified a factor as important, it is not reasonable to exclude it. There is a danger of focusing the analysis on secondary, unimportant factors, resulting in a model that produces poor and unstable results. Such a model is of no practical value.
The collected data must be converted into a common format. Ideally, they are loaded into a database or data warehouse. But simpler formats, such as Excel or a delimited text file, can also be used.
The data must always be standardized, i.e. the same information must be described in the same way everywhere. Usually, problems with standardized representation occur when information is collected from heterogeneous sources. In this case, standardization is a major challenge in itself, but it is beyond the scope of this article.
Representation and minimal quantities
In order for processes of different types to be analyzed, the data must be prepared in a particular way. For simplicity, we can assume that there are three types of data that can be collected:
- Ordered data
- Unordered data
- Transaction data
Ordered data
Ordered data is needed for forecasting tasks that require determining how a process is likely to behave in the future based on available historical information. One of the most common attributes is the date or time, although this may not necessarily be the case. It can also be some kind of reference, such as data collected by sensors over a certain distance.
For ordered data (usually a time series), each column corresponds to a factor, and each row contains time-ordered events with a single interval between rows. The intervals between rows must be equal, and there must be no gaps. In addition, groupings, subtotals, etc. must be excluded, i.e. a regular table is required.
| Nr. | Date | Orders quantity | Sales volume(EUR) |
|---|---|---|---|
| 1 | 2022-05-01 | 256 | 6930.40 |
| 2 | 2022-05-02 | 278 | 7223.95 |
If the process is characterized by seasonality/cyclicity, data must be available for at least one full season/cycle, although the intervals may vary (weekly, monthly...). Since cyclicity can be complex, e.g. quarterly within an annual cycle and weekly within quarters, it is necessary to have complete data for at least one longer cycle.
The maximum forecast horizon depends on the amount of data:
- 1.5-year data - forecast for maximum 1 month;
- Data for 2-3 years - forecast for maximum 2 months;
This indicates the minimum depth (history) for the particular forecast horizon, i.e. the time for which reasonably reliable forecasts can be made. Without at least this amount of data, a data-based forecast is not possible. It should be taken into account that only the simplest algorithms work with the specified minimum amount of data. A more complex mathematical approach requires more data to build a model.
In general, the maximum forecast horizon is not limited only by the amount of data. Prediction models assume that the factors that determine the development of a process will have approximately the same influence in the future as they do now. This assumption is not always accurate. For example, if the situation changes too quickly, if important new factors emerge, etc., this rule will not work.
Therefore, the requirements for the amount of data can vary greatly depending on the task. However, it should also be considered that too much depth is also inappropriate. In this case, we are building the model on an old, irrelevant history, and therefore factors may be considered that may no longer be relevant.
Unordered data
Unordered data is needed for tasks where the time factor is irrelevant, such as credit scoring, diagnostics, customer segmentation. In such cases, we consider the information that one event occurred before another to be irrelevant.
For unordered data, each column corresponds to a factor, and each row contains an example (situation, precedent). The rows do not have to be ordered. No groupings, sums, etc. are allowed - a normal flat table is required.
| Customer ID | Seniority | Car | Loan amount (EUR) |
|---|---|---|---|
| 1 | over 5 years | Yes | 17000 |
| 2 | under 5 years | No | 15000 |
In the collected data, the number of examples (precedents), i.e. the table rows, should be significantly larger than the number of factors, i.e. the columns. Otherwise, there is a high probability that a random factor strongly influences the result. If there is no way to increase the amount of data, the number of factors to be analyzed must be reduced, leaving the most important factors.
It is desirable that the data is representative, i.e. covering as many situations of the real process as possible, and that the proportions of the different examples (precedents) come close to reality. The purpose of data mining is to recognize patterns in the available data, and the closer the data is to reality, the better.
It must be clear that machine learning algorithms cannot know anything beyond the input data. For example, if a medical diagnosis system is only filled with data on sick people, it does not know that there are also healthy people, and therefore, from its point of view, everyone will inevitably be sick.
Transaction data
Transaction data is used in algorithms for associative rule mining, this method is often referred to as "market basket analysis". A transaction refers to multiple objects or actions that are combined into a logically related unit.
This mechanism is often used to analyze purchases (receipts) in supermarkets. In general, we can talk about any related objects or actions, such as the sale of tourist trips with a set of related services (transportation to the airport, tour guides, and so on). Using this method of analysis, we find dependencies of the form "if event A occurred, then with a certain probability event B will occur".
The transaction data for the analysis should be prepared as follows:
| Transaction code | Product |
|---|---|
| 10200 | Cream Yogurt 9% |
| 10200 | Kasseler Bread |
| 10201 | Berliner Bread |
| 10201 | Sugar, 1kg |
| 10201 | Mineral Water, 0.5l |
The transaction code corresponds to the number of the check, invoice or delivery bill. Goods with the same code are part of a single purchase.
The described data representation is sufficient for the usual association rules, where the connections between the individual objects are found. For example, "If you bought cream yogurt 9%, you will also buy Kasseler bread".
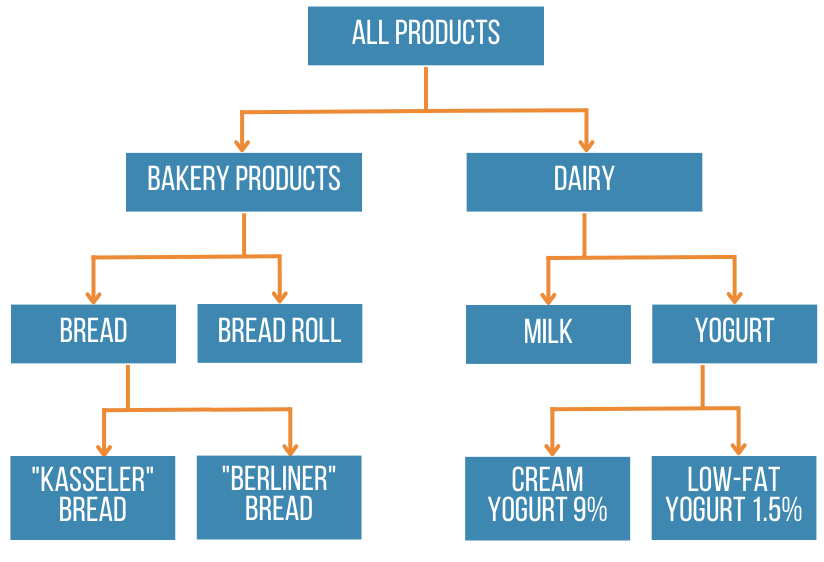
There is also an algorithm for finding generalized associative rules when it is possible to find connections not only between objects, but also between groups of objects. For example, given information about the product groups to which objects belong, it is possible to find relationships such as "If you bought Kasseler bread, you will also buy yogurt." To search for generalized associative rules, it is necessary to prepare additional information with a tree of relations between objects - hierarchy of groups in the following form:
| ID | parent ID | obejekt |
|---|---|---|
| 1 | bakery products | |
| 2 | 1 | Bread |
| 3 | 1 | Buns |
| 4 | 2 | Kasseler bread |
| 5 | 2 | Berliner bread |
| 6 | Dairy products | |
| 7 | 6 | Milk |
| 8 | 6 | Yogurt |
| 9 | 8 | Cream Yogurt 9% |
| 10 | 8 | Low-fat yogurt 1.5% |
ID is the unique number of the object. The parent ID is the number of the parent object. If it is a root object, this field must be empty. The Objects field contains both groups and products.
The table with the object hierarchy corresponds to the following diagram.
For the analysis of transaction data, in addition to associative rule lookup, algorithms can also be used to identify sequential patterns, i.e., to identify patterns that state that after event A, event B will also occur with a certain probability. The data for this is collected in the same way as for associative rule retrieval, but with the addition of an event timestamp.
| Transaction code | Date | Product |
|---|---|---|
| 10200 | 2023-03-20 | Cream Yogurt 9% |
| 10200 | 2023-03-20 | Kasseler Bread |
| 10201 | 2023-03-21 | Berliner bread |
| 10201 | 2023-03-21 | Sugar, 1kg |
| 10201 | 2023-03-21 | Mineral water, 0,5l |
It is advisable to analyze transactions in large data sets, otherwise statistically untenable rules may be uncovered. Associative and sequential pattern matching algorithms are capable of processing large amounts of data quickly. Their main advantage lies precisely in their scalability, i.e., in their ability to process large volumes.
The approximate ratio between the number of objects and the volume of data:
-
300-500 objects - more than 10 thousand transactions;
-
500-1000 objects - more than 300 thousand transactions;
If the number of transactions is not sufficient, it is advisable to reduce the number of analyzed objects, e.g. by grouping them.
Modeling - Analysis
There are a variety of machine learning algorithms, and it is beyond the scope of this article to describe them. Each has its own limitations and solves a particular class of problems. In practice, it is usually possible to achieve success by combining analysis methods.
In general, the following recommendations apply to model building, regardless of the data mining algorithm:
-
Pay close attention to data cleaning. If you have collected the right amount of data, you cannot be sure that it is of good quality. In most cases, the data leaves much to be desired, so you need to preprocess it. There are many methods for this: removing noise, smoothing, processing anomalies, and so on.
-
Combine analysis techniques. This way you can look at the problem from a broader perspective. Also, using different methods to solve the same problem can reveal interesting patterns beyond the applicability of a single algorithm;
-
Do not aim for absolute precision. It is advisable to start using it when the first acceptable results are obtained. It is impossible to create a perfect model anyway. A usable result, even if it is not perfect, will allow you to benefit from machine learning earlier. At the same time, it is possible and necessary to work in parallel to improve the model taking into account the results obtained in practice;
-
Start with simpler models. With the right data, even the simplest models can be useful. If several analysis methods give approximately the same result, it is always worthwhile to choose the simplest method. Simple methods are more reliable, have lower data quality requirements, and are easier to interpret and change. The use of complex algorithms should be justified by sufficient benefits to justify the higher costs of their design and development.
If a qualitative model cannot be created, go back to the previous steps of the data mining process. Unfortunately, mistakes can be made at any step: The initial hypothesis may not be formulated correctly, there may be problems collecting the necessary data, etc. You need to be prepared for this, because data mining is research, i.e. the search for previously unknown patterns.
To assess the appropriateness of the results, you need to consult experts in the respective field. Model interpretation as well as hypothesis generation can and should be performed by an expert, as they require a deep understanding of the process that goes beyond the data being analyzed.
In addition, there are formal ways to assess the quality of the model: test the models on different samples to assess their generalizability, i.e., their ability to produce acceptable results with data that were not provided to the system when the model was created.
Indeed, there are analysis mechanisms that can "remember" the data presented to them and produce excellent results, but that completely lose their generalizability with test data (previously unknown to the system) and produce very poor results. A formal evaluation may be based on the idea that a model that produces acceptable results on test data has a right to exist.
If acceptable results are obtained, you need to start using the models, but it should be clear that starting to use them does not mean the end of the data mining project. It is always necessary to work on improving the models, because in time it will be necessary to go through this cycle again. Moreover, once the first satisfactory results are obtained, the question of improving the accuracy usually arises.
The appropriateness of the model for the current situation should be reviewed regularly, because even the most successful model will, over time, no longer correspond to reality.